

A bone density report can introduce unfamiliar numbers at a moment when you want a clear explanation. T-scores, Z-scores, scan locations, and reference ranges all describe something specific. Reading them together is more helpful than looking for one number that defines the health of your entire skeleton. This interactive bone density score chart helps you locate a reported score, understand the language used around it, and prepare better questions for your healthcare professional.
The chart is a reference for adults, not a diagnosis or a fracture-risk calculator. It does not calculate bone density from age or sex. Enter a score already listed on your report, choose the relevant comparison, and use the explanation alongside the clinician's interpretation. If you are unsure which score applies, the report and the ordering clinician are the best starting points.
Key Takeaways
- A T-score compares bone mineral density with a young-adult reference; a Z-score uses an age-matched reference.
- T-score classification is generally used for postmenopausal women and men age 50 and older.
- Younger adults generally need Z-score interpretation, with medical history providing essential context.
- A score is one part of bone health. Previous fractures, medications, and other factors also matter.
- Different scan sites and repeat tests require professional interpretation rather than simple averaging.
What Does a Bone Density Test Measure?
A central DXA scan estimates bone mineral density, commonly at the hip and lumbar spine. The report may include density in grams per square centimeter as well as comparison scores. These are related measurements, but they are not interchangeable. A T-score of minus two is not a statement that someone has lost two percent of their bone, and a result from one location does not describe every bone equally.
Think of the report as a set of observations that need a frame of reference. The scan location tells you where the measurement was taken. The score tells you how that measurement compares with a defined reference group. Your history helps explain what the finding means for you. Bringing the complete report to an appointment preserves this context much better than sharing a single screenshot of one number.
How to Read a T-Score Chart
For the adult groups in which T-score classification applies, a score of minus one or higher falls in the normal reference category. A score below minus one and above minus 2.5 falls in the low bone mass range, often called osteopenia. A score of minus 2.5 or lower falls in the osteoporosis densitometric range. These boundaries describe standard reference categories, not an individualized treatment decision.
The distinction at the boundary matters. Minus 2.5 belongs to the osteoporosis range; minus one belongs to the normal range. However, being on one side of a threshold does not erase other health considerations. A healthcare professional may identify clinically important fracture risk or osteoporosis based on additional findings, including certain fragility fractures. This is why a favorable-looking chart result should never override the clinician's assessment.
When Is a Z-Score More Useful?
Z-scores are generally preferred for women before menopause and men younger than 50. A Z-score of minus two or lower is described as below the expected range for age. A score above minus two is described as within the expected range for age. The terminology is deliberately different from the T-score categories because the clinical questions and reference populations differ.
Age alone cannot settle every interpretation. Menopausal transition, hormone history, underlying conditions, and the reference database used by the reporting facility can affect how a result is discussed. If your circumstances do not fit a simple category, choose the unsure option in the tool. It will explain the score types without assigning a T-score classification to you. Pediatric reports require a different framework and are outside this adult reference.
Why a Bone Density Chart by Age Has Limits
People searching for a female bone density chart by age often want reassurance that their result is typical. That is understandable, but a universal age chart cannot replace the reference data and methods used for an actual scan. Age also does not tell the full story of skeletal health. Two adults of the same age may have different fracture histories, health conditions, medications, and physical capabilities.
This tool therefore avoids estimating an ideal bone density from your birthday. Instead, it explains the comparison already provided by the scan facility. That approach gives you a useful way to read your report without creating a false precision. If a result differs from what you expected, ask which reference population was used and whether any features of the scan affect its interpretation.
Hip and Spine Results Can Differ
A report may list multiple results, including lumbar spine, femoral neck, and total hip measurements. These represent different skeletal locations. It is possible for their scores to fall in different ranges. That does not automatically mean the report is inconsistent. A clinician considers the appropriate sites, scan quality, and circumstances rather than blending the numbers into a homemade average.
When using the chart, enter one reported score at a time and keep its site written beside it. This makes your questions easier to answer at an appointment. You might ask why the spine and hip results differ, which measurements are suitable for clinical decisions, and whether the report identifies any technical limitations. Avoid assuming that the most reassuring number cancels out a finding at another valid site.
Can You Compare This Scan With Your Previous Scan?
Follow-up testing can help clinicians evaluate change, but a small numerical difference may reflect measurement variability. Different machines, facilities, positioning, and analysis methods can complicate comparisons. A chart that simply subtracts two T-scores cannot determine whether a change is clinically meaningful. Ask whether the facility has assessed the difference using its precision data and least significant change.
Prepare for the discussion by keeping the dates, facilities, measured sites, and original reports together. If you moved or changed testing centers, mention that before drawing conclusions. This also helps you avoid interpreting a technical difference as proof that a supplement, exercise plan, or wellness device improved or worsened your bones. Changes deserve interpretation in the setting of the complete care plan.
Build an Appointment Checklist
After locating your score, use the question card to organize the conversation. Useful questions include: Which score should guide our discussion? Do my previous fractures affect the interpretation? Should we review medications or possible contributors to low bone density? What activities are appropriate for me? When should I return for follow-up, and what would count as a meaningful change?
You do not need to arrive with every answer. The purpose of the checklist is to make an unfamiliar report easier to discuss. Keep questions focused on decisions you can make with your clinician rather than trying to diagnose yourself from a chart. If you have new pain after a fall or suspect a fracture, seek assessment instead of waiting for a routine bone health visit.
Where Everyday Bone Health Fits
Nutrition, appropriate activity, fall prevention, and prescribed care can all belong in a broader bone health conversation. The right balance depends on individual needs. Someone with recent fractures may need different movement guidance from someone planning a general wellness routine. A registered dietitian or qualified clinician can also help assess dietary intake before you decide whether supplementation is necessary.
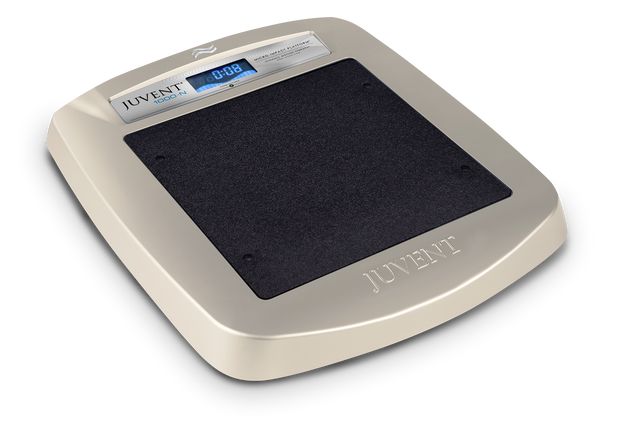
For readers considering vibration technology, the relevant comparison includes signal characteristics, calibration, intended use, and evidence for the specific device. Juvent's low-magnitude Micro-Impact approach can be explored as a separate discussion about exercise and rehabilitation technology. The chart does not recommend a platform based on a scan result, and a low score is not a reason to start vibration without appropriate clinical guidance.
Understand Research Without Turning It Into a Promise
Research into mechanical stimulation includes different populations, devices, and protocols. A study result cannot automatically be transferred to every person with a similar score. When reviewing a claim, ask what was measured, which device was used, how participants were selected, and whether the study reported outcomes relevant to your question. These details are more useful than a broad statement that a technology is good for bones.
In the United States, Juvent remains investigational for osteoporosis treatment and improvement or maintenance of bone mineral density. Registration as a Class I device for exercise and rehabilitation does not establish FDA clearance to treat osteoporosis. Continue recommended care and discuss any proposed addition with your healthcare professional. Understanding those boundaries helps keep product research separate from the interpretation of your scan.
Frequently Asked Questions
Is a T-score the same as bone density?
No. Bone mineral density is a measurement, while the T-score expresses how a measurement compares with a reference group. Your report may include both. Keep the units and labels attached to the values when discussing the results, especially if you have reports from different facilities.
Does a normal score mean I cannot have a fracture?
No. Fracture risk depends on more than the score. Falls, previous fractures, medications, and other clinical factors can matter. The reference category should be considered within a broader assessment, rather than treated as a guarantee about future injuries or an instruction to stop preventive care.
Can this chart calculate my fracture risk?
No. It explains score terminology and reference categories. It does not use a validated fracture-risk model, calculate a probability, or recommend medication. Ask your clinician whether a separate risk assessment is appropriate and how its result would affect your care plan.
Should I use a T-score or Z-score?
Use the score identified on your report and discuss which comparison applies with your clinician. The tool explains the usual adult distinction and withholds a personalized T-score category when the selected context does not support it. Menopausal status and other clinical details can matter.
Can Juvent change my bone density score?
No individual result should be assumed. Low-magnitude vibration has been studied, but findings depend on the population and protocol. Juvent is investigational for osteoporosis and bone mineral density outcomes in the United States. A platform should not replace prescribed treatment, follow-up testing, or individualized medical advice.
Sources & further reading
Sources support the educational context. Interactive matching and question prompts are editorial aids, not validated clinical models. Food values are curated reference examples, not a complete database.